Reading Bank Gold Forecasts Like a Stacker: Why the Targets Disagree by Thousands

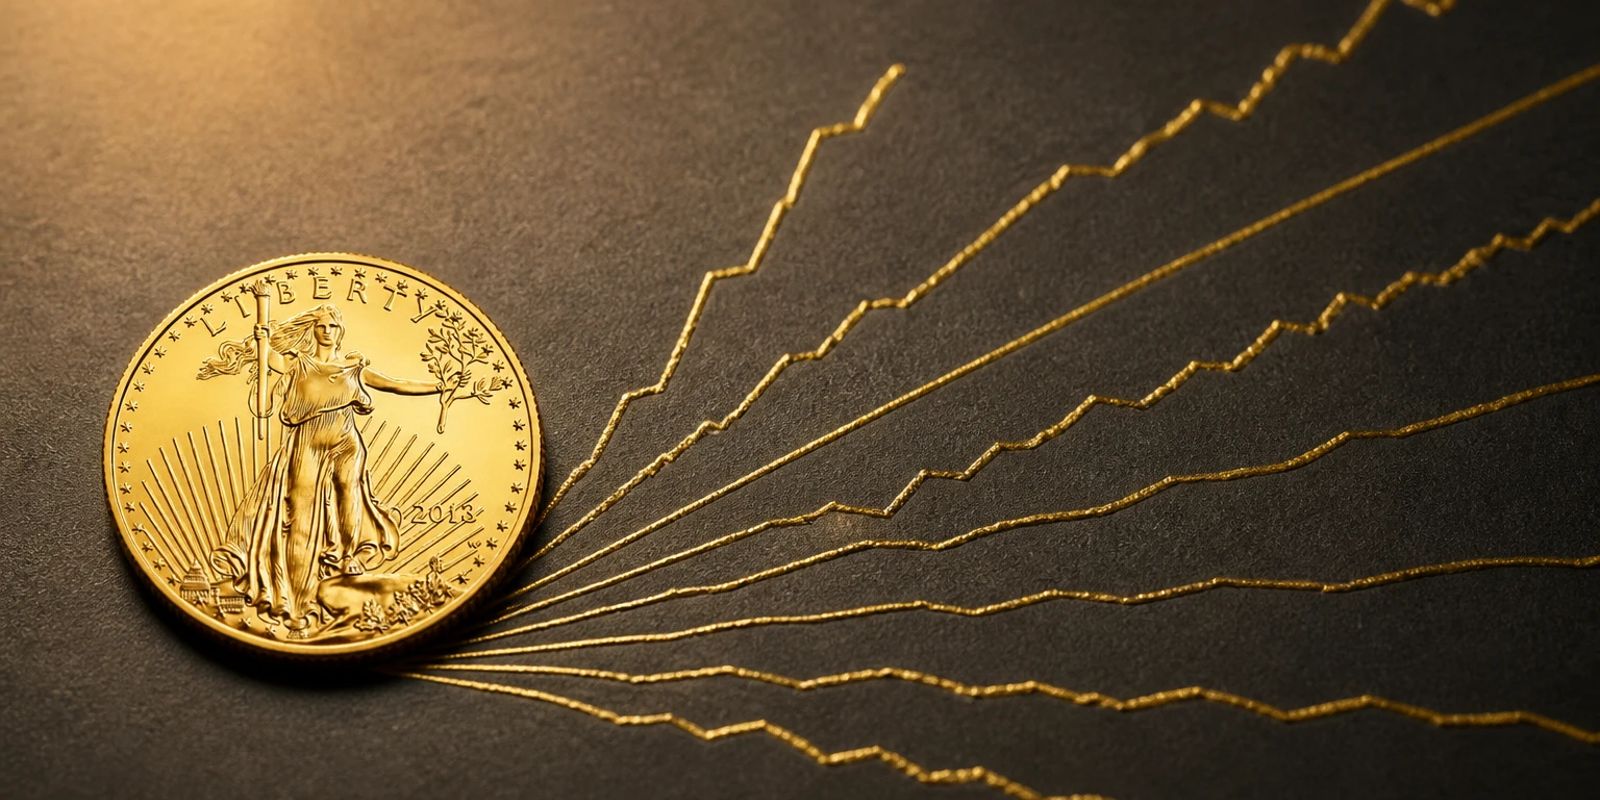
At one point in mid-2026, the year-end gold targets of major institutions looked like this: StoneX near $4,000, HSBC $4,560, Goldman Sachs $4,900 (freshly cut from $5,400), JPMorgan holding $6,000, Deutsche Bank $6,000, Wells Fargo $6,100–6,300. The same metal, the same data, a $2,300-per-ounce disagreement. Within weeks, several of those numbers moved again.
Source: Published bank research, mid-2026; Wells Fargo shown at the midpoint of $6,100–6,300
Stackers get whiplash trying to trade these headlines — which is why the community has developed a specific way of reading them. Not "which bank is right?" but "what does the disagreement itself tell me?" This guide is that reading method, with the receipts.
Why smart desks disagree by thousands
The 2026 Goldman–JPMorgan divergence is the perfect case study. Goldman cut $5,400 → $4,900 in June for one mechanical reason: its economists removed expected Fed rate cuts from their model, and by the bank's own formula, fewer cuts subtract roughly $240/oz of rate support. JPMorgan didn't move — its $6,000 rested on a different foundation entirely: central bank and investor flows (its research attributes ~70% of quarterly gold price change to that demand), with 244 tonnes of estimated central-bank buying in Q1 2026 alone. Two banks, two theories of what gold is — a rate-sensitive asset versus a flow-driven monetary asset. The spread isn't confusion; it's competing models priced honestly.
Notice what almost no bank disputed: direction. Even the bearish targets sat above or near spot, and the 2027 cluster ($5,000–5,600 from JPMorgan, UBS, Goldman; Bank of America's extreme scenario at $8,000) leaned the same way. Banks disagree on the timeline, not the destination — and their revisions chase the Fed, which is why targets can move three times a year without anyone being incompetent.

The stacker's forecast filter
- Read the reasoning, skip the number. "Central banks bought 244 tonnes in Q1" is durable information (see why central banks are buying). "$6,000 by December" is a model output with a shelf life of one Fed meeting.
- Watch the spread, not the average. A tight cluster means consensus (and little edge); a $2,300 spread means the market itself doesn't know the timing — which is precisely when schedule-based buying beats conviction bets.
- Count the direction votes. When every major desk — plus the permabulls like Schiff and Kiyosaki calling sub-$4,000 gold a gift — points the same way and only the dates differ, that's as close to signal as forecasts get.
- Remember what forecasts are for. Banks publish targets for clients who trade. Stackers accumulate. A number that expires in a quarter shouldn't move a plan measured in decades.
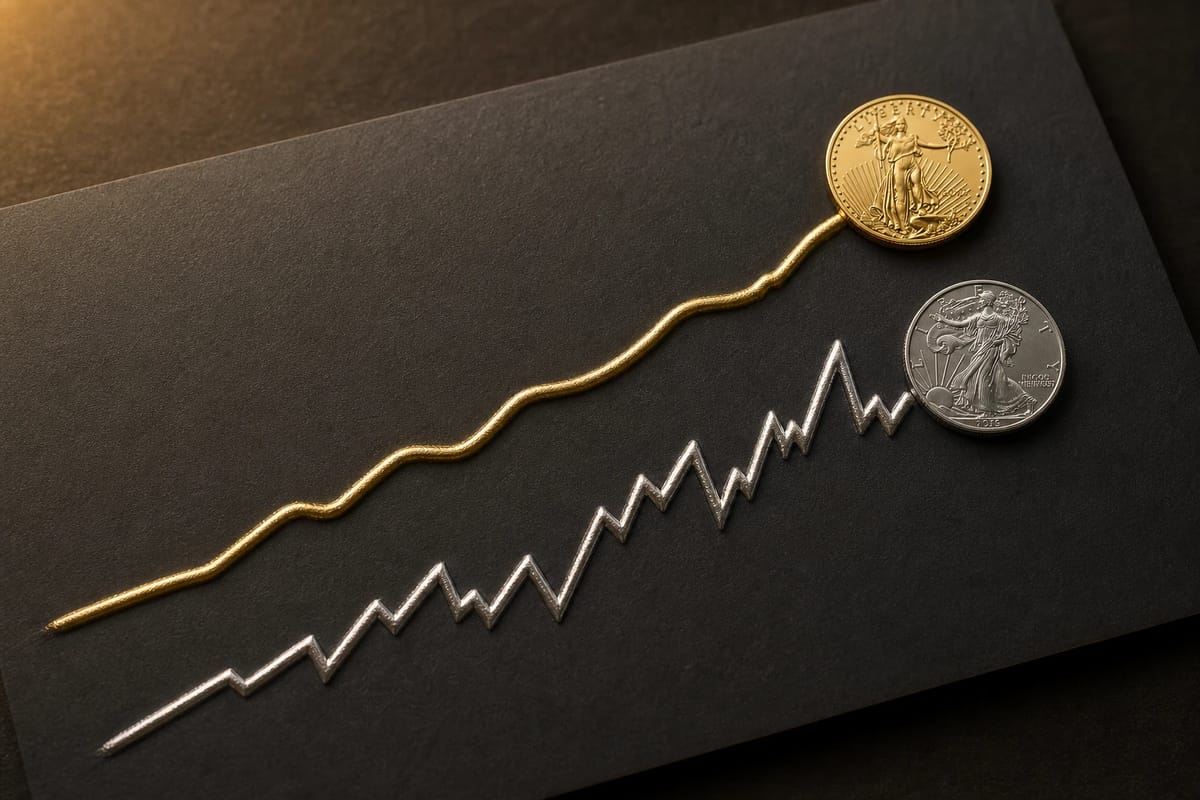
The zoom-out banks can't revise: five years before mid-2026, gold traded near $1,750. It has since touched $5,600 and settled in the mid-$4,000s — roughly +160% across the period, through every downgrade cycle. The stackers who captured it weren't following targets; they were following a schedule. Two years ago people called $2,450 gold overpriced. Every new high feels expensive until the next one.
Silver forecasts: the wilder cousin
Silver targets make gold's spread look tame — recent institutional calls have ranged from JPMorgan's ~$85 to Bank of America's $309 scenario, a 4x disagreement. The reasons are structural: a smaller market, an industrial demand model (solar, electronics) layered on the monetary one, and the supply dynamics covered in the deficit guide. The filter works the same way — direction consensus is meaningful, magnitude is theater. And after silver's 2025 (+148%) and 2026's 40% correction, both bulls and bears have recent evidence; see crash history for why that's normal.
| What forecasts are good for | What they're terrible at |
|---|---|
| Surfacing the drivers (rates, flows, deficits) | Nailing the date anything happens |
| Showing where consensus sits | Surviving one surprise Fed meeting |
| Confirming direction when unanimous | Telling you what to do this week |
| Reminding you of scenarios (incl. extremes) | Being accountable when wrong |
Frequently asked questions
Should I wait to buy until the bearish targets play out?
That's timing wearing a forecast costume. If StoneX's $4,000 arrives, your dip rule (see buying dips) buys it automatically; if JPMorgan's $6,000 arrives first, your schedule already owned the ride. The system covers both banks being right.
Why do targets always seem bullish?
Survivorship in what gets quoted, plus honest structural drivers (debt, central-bank demand). But downgrades happen constantly — Goldman, HSBC, and JPMorgan all cut within weeks in 2026. The bullish tilt is real; so is the churn.
Whose forecasts should I actually follow?
Follow the World Gold Council's demand data and the Silver Institute's supply surveys — the inputs banks build models from. Primary data ages far better than price targets.
Banks forecast so traders can trade. Stackers read the forecasts for drivers, note the unanimous direction, and let the schedule do the rest — because the one call that's never been revised is that ounces held beat targets published.