The Silver Supply Deficit, Explained: Six Years of Drawing Down the World's Stockpiles

Here's the structural fact underneath every silver conversation of the past few years: the world uses more silver than it produces, and has every year since 2021. According to the Silver Institute's World Silver Survey, the cumulative shortfall through 2026 has drawn roughly 762 million ounces out of above-ground stockpiles — close to a full year of global mine output, consumed over and above what mines and recyclers supplied.
Deficits don't move price on a schedule; stockpiles exist precisely to absorb them. But six consecutive years of drawdown changes the market's foundation — and the visible symptoms, from vault outflows to Asian premiums, are what this guide walks through.
The numbers, year by year
| Year | Market balance (Moz) | Note |
|---|---|---|
| 2021 | −75.0 | The deficit era begins |
| 2022 | −237.7 | The deepest shortfall on record |
| 2023 | −168.9 | Industrial demand hits new records |
| 2024 | −140.3 | Total demand ~1.16 billion oz |
| 2025 | −40.3 | Mine supply +3% to 846.6 Moz; demand ~1.13 Boz |
| 2026 (forecast) | −46.3 | Sixth consecutive deficit |
Source: Silver Institute / Metals Focus, World Silver Survey 2026
Source: Silver Institute / Metals Focus, World Silver Survey 2026. Note what happened in 2025: prices averaged $40.03 — up 42% year-on-year — mine production rose, solar manufacturers engineered out some silver, and the market still ran a deficit. Higher prices narrowed the gap; they couldn't close it.
Why mines can't just make more
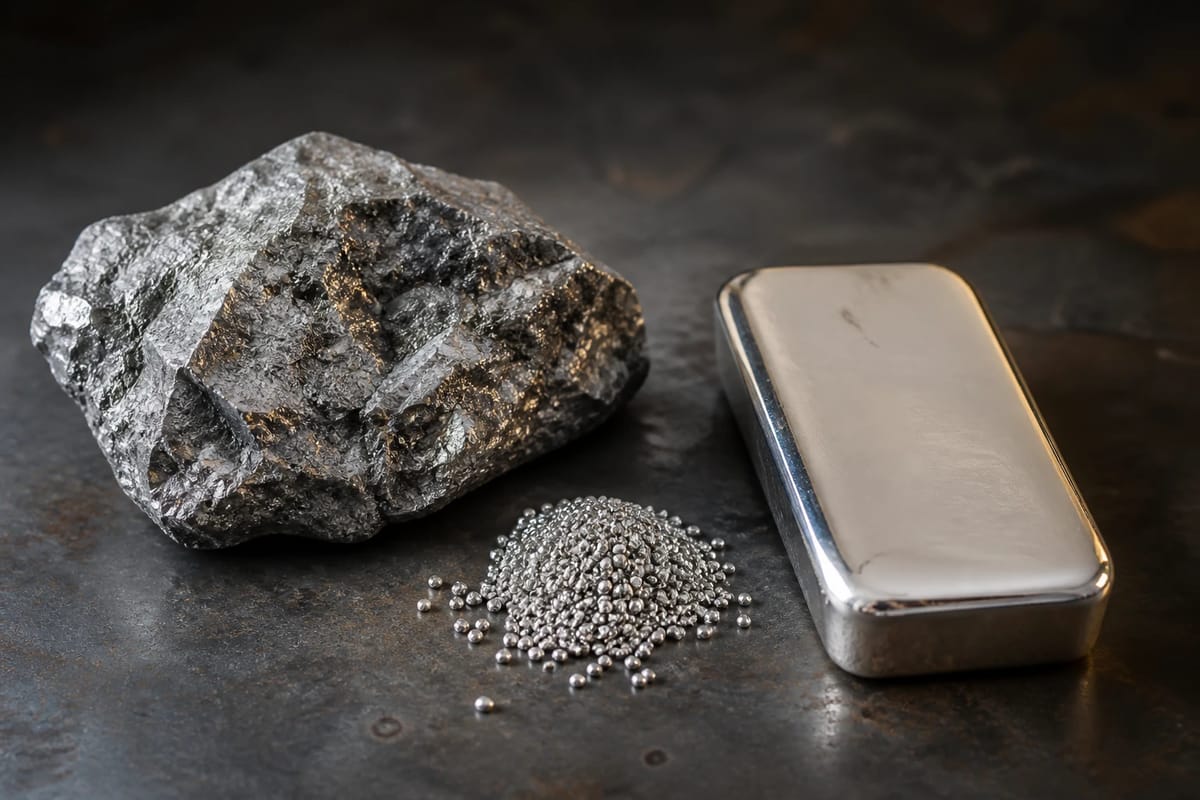
Silver has a supply problem money can't quickly fix: roughly 70% of it comes out of the ground as a byproduct of copper, lead, zinc, and gold mines. Those operations expand based on their primary metal's economics, not silver's — so a higher silver price barely moves the biggest supply lever. Primary silver mines, the minority that respond to price directly, face declining grades and exhausted deposits (Mexico and Peru have both seen closures even at elevated prices), and a new mine takes the better part of a decade from discovery to production. The project pipeline, by most assessments, cannot close a 40–46 million ounce annual gap this decade.
Demand, meanwhile, is structural. Industry now takes over half of all silver — a record share — led by photovoltaics: solar demand ran near 190 million ounces at its 2025 peak before "thrifting" (using less silver per panel) trimmed it toward ~150 million in 2026. Electronics, EVs, and grid build-out keep the floor rising, and much of that industrial silver is effectively gone forever — dispersed in products at concentrations too low to recycle economically.

Watch the vaults and the premiums
When a market runs deficits, the drawdown has to show up somewhere — and it does. COMEX registered silver inventories fell roughly 70% from their 2020 peak. London vaults have supplied large outflows eastward: in one stretch, the UK imported 600+ tonnes of silver from the US in a month and shipped nearly all of it onward to China and India. Shanghai vault inventories have swung through rapid multi-week drains. The metal is migrating from Western financial vaults to Asian industrial and investment demand.
Premiums tell the same story in price form. Shanghai silver has traded $10–20 over Western spot — at one 2026 extreme, roughly 13% — and Indian gold premiums have spiked when import pipelines tightened. A persistent premium in the world's biggest consuming region is the physical market outbidding the paper price for actual bars. Stackers watch it as a demand gauge that can't be spoofed — part of why the community insists the premium, not the ticker, is the real price signal (more in paper vs. physical silver).
China's buying, quantified: in early 2026, reported Chinese purchases ran 320 tonnes in January, 470 in February, and a record 836 tonnes of silver in March — alongside 162 tonnes of gold. China manufactures around 80% of the world's solar panels; securing the metal that feeds that industry is policy, not speculation.

What it means for a stacker
Honestly: not a timing signal. Deficits coexisted with 2026's 40%+ price correction — stockpiles buffer the gap, and paper markets set the daily price. What the deficit does change is the long-horizon math. A market structurally consuming its inventory, with supply that can't respond to price and demand welded to energy transition, is a market where patience is the strategy. That's the thesis behind steady accumulation (systems), buying weakness (dips), and holding real ounces rather than promises.
Frequently asked questions
If there's a deficit, why did the price fall in 2026?
Because above-ground stocks and paper markets absorb deficits in the short run. The deficit is a slow structural drain, not a daily price driver — conflating the two is how people get disappointed with true facts.
Won't recycling close the gap?
Recycling supplies meaningful ounces, but most industrial silver is dispersed in tiny quantities per device — solar panels and electronics are rarely economic to reclaim. Scrap responds to price slowly and modestly.
Could solar thrifting kill the demand story?
It trimmed PV demand ~19% into 2026 — and the market ran a deficit anyway. Thrifting slows the drain; the combination of grid, EV, and electronics growth keeps total industrial demand near record highs.
Six deficits in, the patient stackers aren't predicting a squeeze — they're just holding the thing everyone keeps consuming.