Silver Price History: From Ancient Money to the 1980 Squeeze, the 2011 Peak and Today

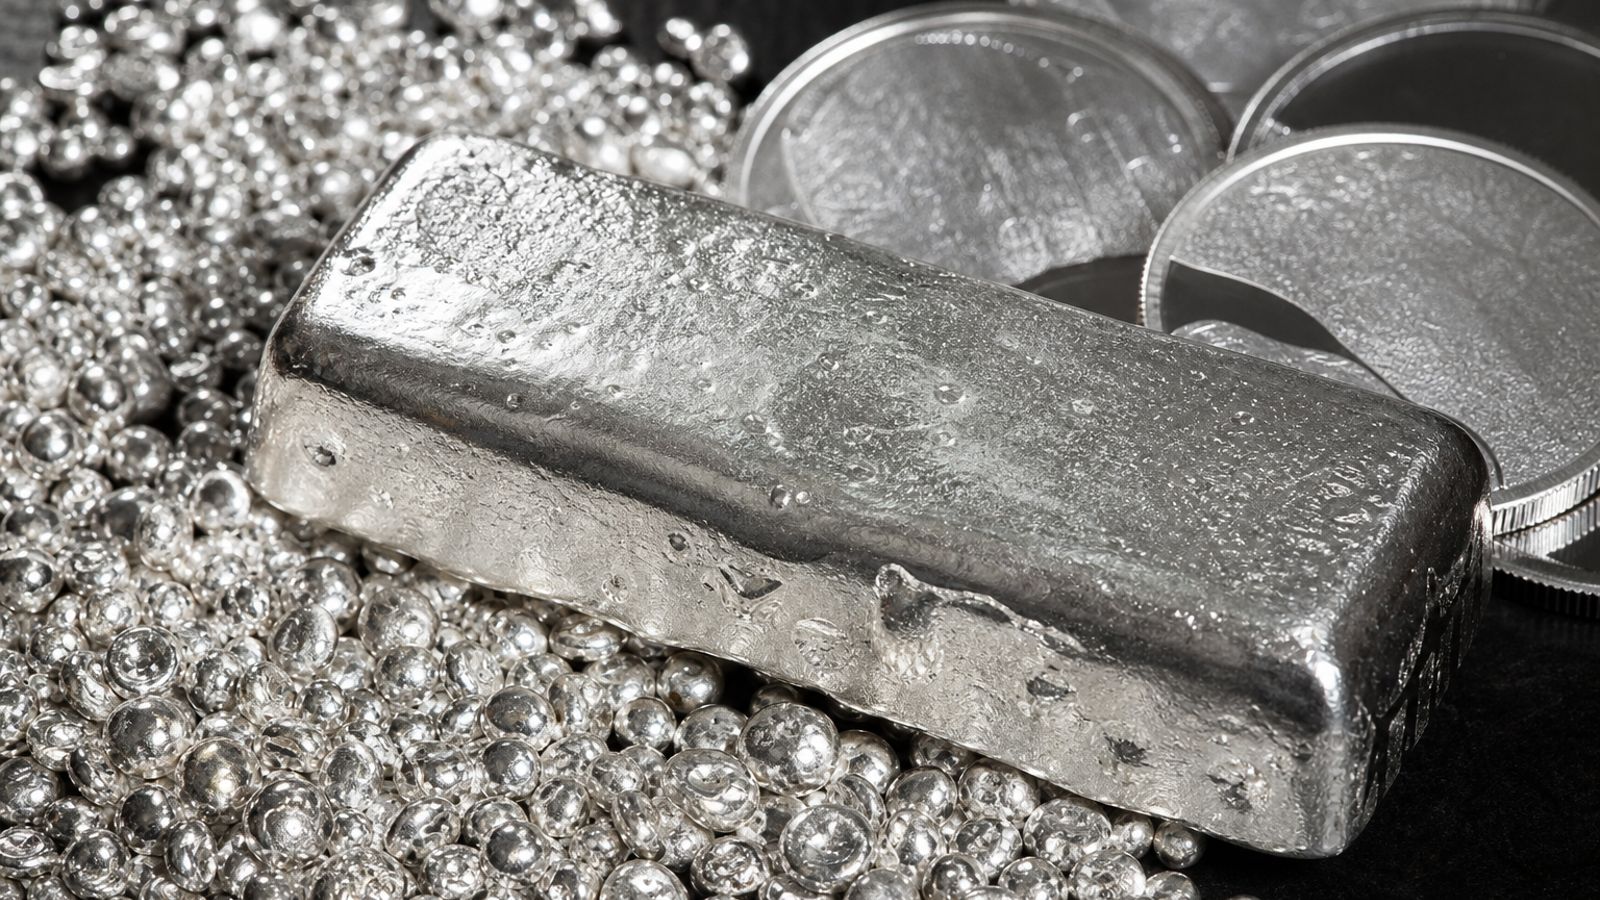
Silver has been valued for thousands of years, first as money alongside gold and later as a critical industrial metal. Its price history is unusually volatile because it serves two roles at once: a store of value and a raw material for technology. Understanding how that value shifted over time helps explain why silver moves the way it does today.
From Roman coinage to the U.S. mint: the gold-to-silver ratio
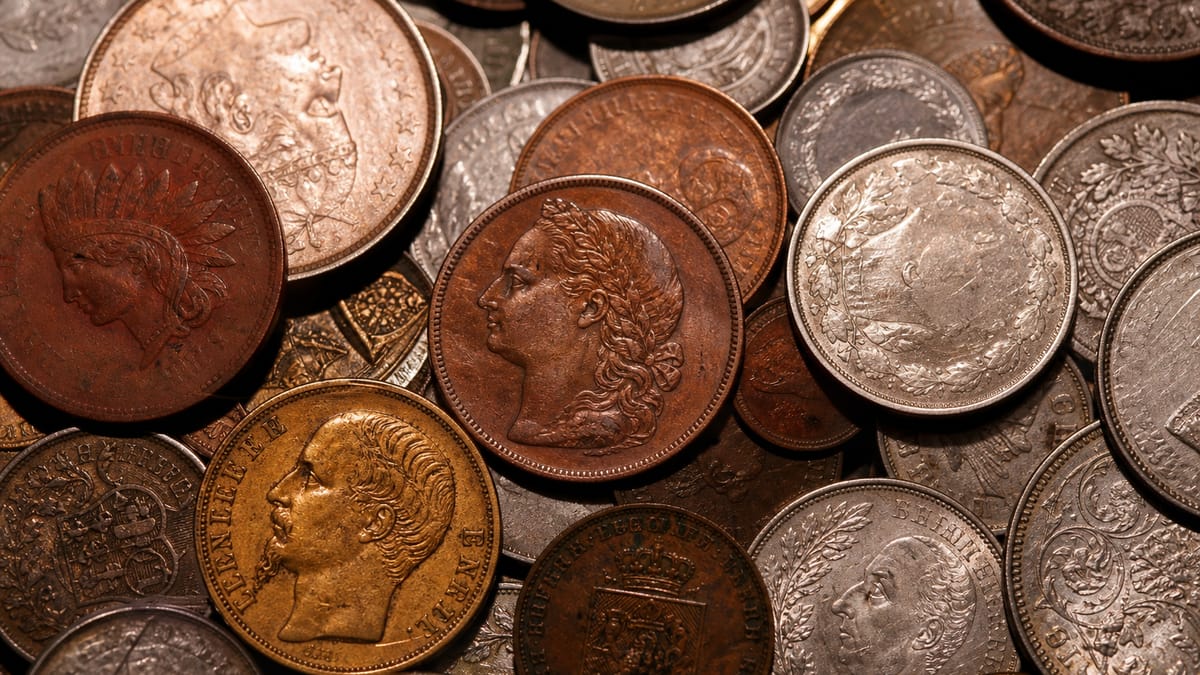
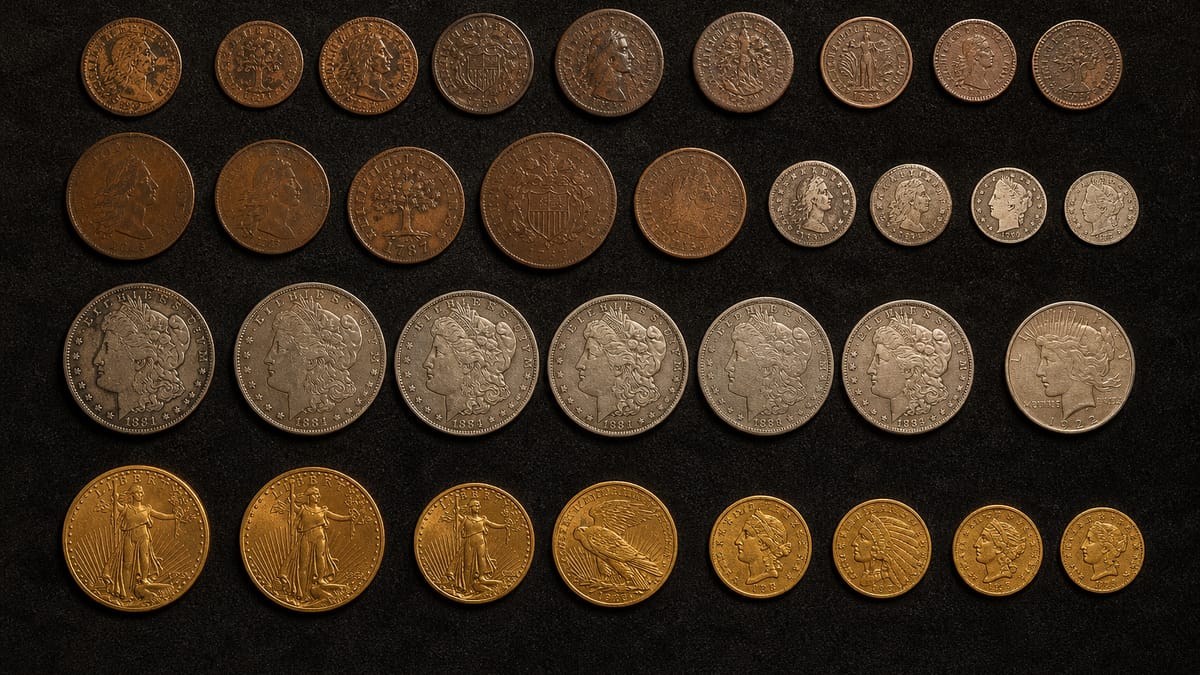
For most of recorded history, gold and silver were both money, and their relationship was measured by the gold-to-silver ratio: the number of ounces of silver needed to buy one ounce of gold. Because gold was rarer, it commanded a higher price, and the ratio stayed remarkably steady for centuries.
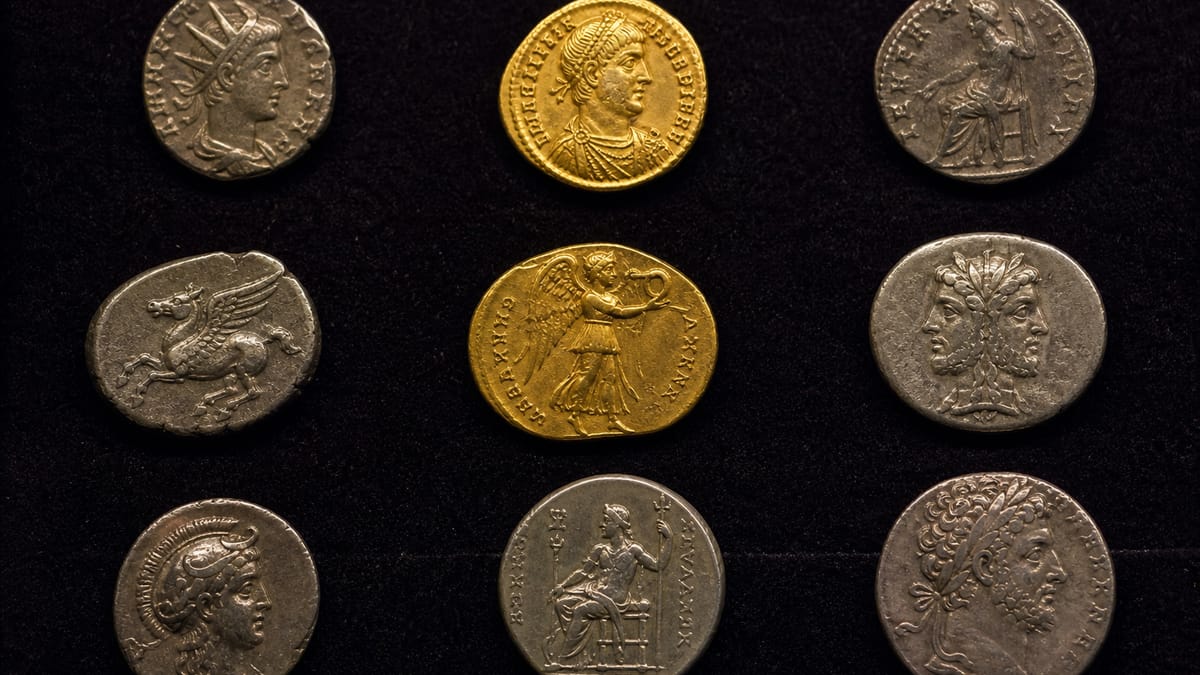
The Roman Empire set the ratio at roughly 12:1.
The U.S. Coinage Act of 1792 established it at 15:1.
For nearly two thousand years the ratio rarely strayed outside a 10:1 to 20:1 band. That stability held because both metals shared the same job: they were currency. The historic ratio remains a benchmark investors watch, since a ratio far above its long-term range can signal that one metal is cheap relative to the other.
PeerMetals Insight
The long-run gold-to-silver ratio gives investors a frame of reference. The ratio sits far higher today than its historic 12:1 to 15:1 norms, and that gap is one of the data points traders use to judge whether silver looks undervalued against gold.
The "Crime of '73": silver loses its monetary status
The 19th century was a fight over the foundation of American money. The country ran on bimetallism, in which both gold and silver were legal tender. The Coinage Act of 1873 changed that. By ending the minting of standard silver dollars, it put the United States on a de facto gold standard and effectively demonetized silver.
The move set off a political firestorm. Pro-silver advocates, mostly indebted farmers and Western miners who wanted the inflation that more silver money would bring, attacked the law as the "Crime of '73." The fight peaked with William Jennings Bryan's 1896 "Cross of Gold" speech, in which he declared, "You shall not crucify mankind upon a cross of gold." Bryan lost the election, but the episode showed how deeply silver was tied to American economic life.
The "Crime of '73" is a lesson in how a single piece of legislation can reshape an asset's value. It is also why many savers favor a physical asset whose worth is recognized by the global market rather than by one government's policy alone.
The Hunt brothers' corner: silver hits nearly $50
The most dramatic chapter in silver's price history belongs to two Texas oil billionaires, Nelson Bunker Hunt and his brother William Herbert Hunt. In the high-inflation 1970s, they began buying physical silver to protect their wealth, and the effort grew into an attempt to corner the global market.
From 1979 into 1980, the Hunts and their Saudi partners built an enormous position, estimated at more than 100 million ounces of physical silver plus a large, heavily leveraged stake in the futures market. Their relentless buying created a historic supply squeeze. Silver, which had traded around $6 an ounce a year earlier, soared to nearly $50 an ounce in January 1980.
The peak did not last. Reacting to the extreme volatility, the commodity exchanges and federal regulators changed the rules, sharply raising margin requirements and at one point restricting trading to liquidation only. Combined with the Hunts' heavy leverage, that triggered a collapse. On March 27, 1980, known as "Silver Thursday," the Hunts failed to meet a $100 million margin call, panic set in, and silver fell by more than 50 percent in a single day.
PeerMetals Insight
The Hunt brothers' downfall came from leveraged futures contracts, not from the physical metal itself. Owning silver outright, without leverage, gives exposure to price moves without the margin calls that ended their corner.
The modern era: both roles return
In the 21st century, both sides of silver's identity reasserted themselves.
The 2011 investment surge: After the 2008 financial crisis, investors searched for safe havens. As gold climbed to record highs, many treated silver as a cheaper alternative, and that wave of demand pushed silver back toward its earlier high, reaching about $49 an ounce in 2011. Its old role as a monetary metal was clearly intact.
The industrial driver: Silver has the highest electrical and thermal conductivity of any metal, which makes it hard to replace in modern technology. It is a key material in solar panels (photovoltaics), electric vehicles, 5G networks, and a wide range of electronics. As governments push the transition to green energy, industrial demand for silver is projected to outpace supply, providing a long-term fundamental support for its price.
This combination is what makes silver unusual: it can rally on economic fear, through investment demand, and on economic optimism, through industrial demand. That gives owners more than one reason to hold it.
Why silver's history matters
Silver's path runs from trusted money to a political flashpoint, through a famous market squeeze, and into a central role in modern technology. Its volatility is a direct result of that dual nature, which is also what makes it such a closely watched metal. Looking past day-to-day price swings to this longer story is the best way to understand what silver is and why its value has moved the way it has.
Explore the PeerMetals marketplace to find silver bullion and coins from trusted sellers.
Silver price history by era
The modern silver price dates from the 1960s, when the United States stopped fixing it through coinage and let it trade freely. Silver was around $1.29 per ounce in 1963, the last year the Treasury defended that level, and drifted between $1.50 and $2.50 through the late 1960s once the 1965 Coinage Act removed it from dimes and quarters. The 1970s inflation carried it above $5, and the Hunt brothers' attempt to corner the market drove it to a record near $50 in January 1980 before the collapse that followed. Silver then spent two decades mostly between $4 and $7, bottoming near $4 in 2001.
The 2000s commodity boom lifted it back above $20 by 2008, and the post-crisis rally took it to a second peak just under $50 in April 2011. It fell to about $14 by 2015 and traded in a $14 to $20 range until 2020, when it spiked to $29 during the pandemic. The rally that began in 2024 pushed silver through $30, then $40, and to new all-time highs above $50 in 2025 on industrial demand from solar and electronics combined with investment buying. Today's price is $60.38 per ounce, and the live silver price page shows the full chart back to 1970.